Avisoft SASLab Pro, version 5.3.2 (26 January 2026)
-
The Create labels from waveform events dialog box has got a filter option to exclude unwanted noise.
- The batch processing tool has been expanded. The new functions are Time/Pitch Conversion, Import section labels from .txt file and Delete all labels.
- The FIR filter tool has got a gain option (apply digital gain) for balancing signal level drops caused by user-defined frequency response compensation filters and the FIR filter algorithm has been optimized, which excelerates FIR filter operations by about 50%.
- The frequency response editing functionality (Edit > Filter > Time Domain FIR Filter > User-defined > Edit) has been improved. Frequency responses can now be viewed and edited in logarithmic dB units by activating the new Curve window option Display > logarithmic Frequency Response display and a few navigation commands (pan, zoom, unzoom,
and display range) have been added (see Curve window > Display). The newly added editing commands Subtract another Frequency Response…, Smooth Frequency Response and Resample Frequency Response can help preparing frequency response compensation filters (see Curve window > Edit).
- The thresholds for measuring minimum/maximum frequencies and bandwidth on the Automatic Parameter Measurements tool can now be defined in absolute units when the newly added abs option is activated.
- The single threshold element separation method has got a max freq. change option for segmenting bird song notes that are separated by freqeuncy jumps rather than silent breaks, such as found in cowbirds (Element Separation).
- The minimum .wav file duration required for SMPTE time code decoding has been reduced from 1.1 seconds to 80 milliseconds (2 video frames).
- The main window drop-down menu command Edit > Synthesizer > Insert time code / pulse train / single pulse / ramp… has got an amplitude field to customize the amplitude of the generated waveforms and a filter option to reduce ringing when the generated square wave signals are being filtered.
- To further improve the measurement capablities, an amplitude cursor and a crosshair measurement cursor have been implemented on the main window. See Analyze > Measurement mouse cursor and a screenshot. On the spectrogram windows is now also possible to measure sound levels on the waveform display (screenshot). Visual sound level measurements are supported on the main and spectrogram windows by showing the root mean square (rms) trace on the wavevorm displays (drop-down menu item Analyze > Show root mean square trace).
- The display options for the UltraSoundGate DIO track have been extended. The new drop-down menu option UltraSoundGate DIO display style > allows choosing different line widths and an alternative gray background color of the waveform display.
- The main window command Edit > Format > Stereo -> mono / Mix… has got an automix option that allows to improve the signal-to-noise ratio in multi-microphone setups.
-
The command Analyze > One-dimensional transformation > Frequency response, sine sweep mono now allows to save frequency response .flf files and the curve window command Edit > Normalize Shape has been added to better support creating equalizing FIR filters.
- The main window command File > Specials > Create multichanel file… has got a new button for creating combined filenames (Combine filenames!).
-
The batch command Pulse Train Analysis adds logging the Overall Measurements into the logfile Pulse Train Analysis.txt.
- The new main window command File > Specials > Create multichanel file… simplifies the generation of multichannel .wav files that are needed for the UltraSoundGate Player 216H and 416H devices.
- The new main and spectrogram window command Tools > Labels > Rename labels… can accelerate annotating vocalizations by clicking buttons of predefined text modules.
- The Automatic Parameter Measurements tool can now measure the sinuosity and curvature of elements (see Location of measurements – more…).
- The maximum number of threads for spectrogram calculation (Analyze > Spectrogram Parameters > Threads) has been increased to 24 (taking advantage of the capabilities of new multi-core CPU models). An occasional issue of the multithreading option in long spectrograms (Threads > 1) on some computers has been fixed.
- Both the main and spectrogram window editing tools now support unlimited undo levels (main window command Edit > Undo and spectrogram window command Tools > Undo last modification).
-
The sum and mean parameters of the Time derivative of entire element toolset can now be combined with the use absolute values and calculate slope (kHz/ms) options, which allows to quantify the average frequency modulation of elements (expressed in kHz/ms).
-
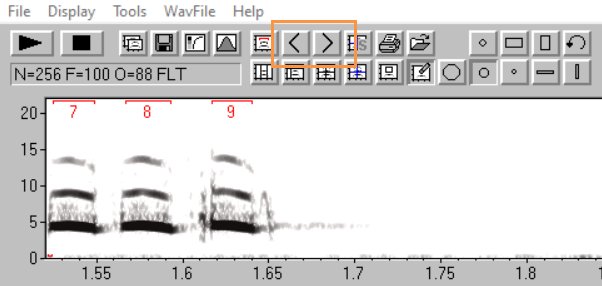
The spectrogram window commands Tools > Automatic Parameter Measurements > Move to previous/next element can now also be accessed through buttons (see screenshot).
